


Metadata
Introduction
The Metadata page can be accessed by clicking on the tab with the same name within a dataset page. This page shows all the metadata associated to such dataset (either added manually or automatically by ShowVoc).
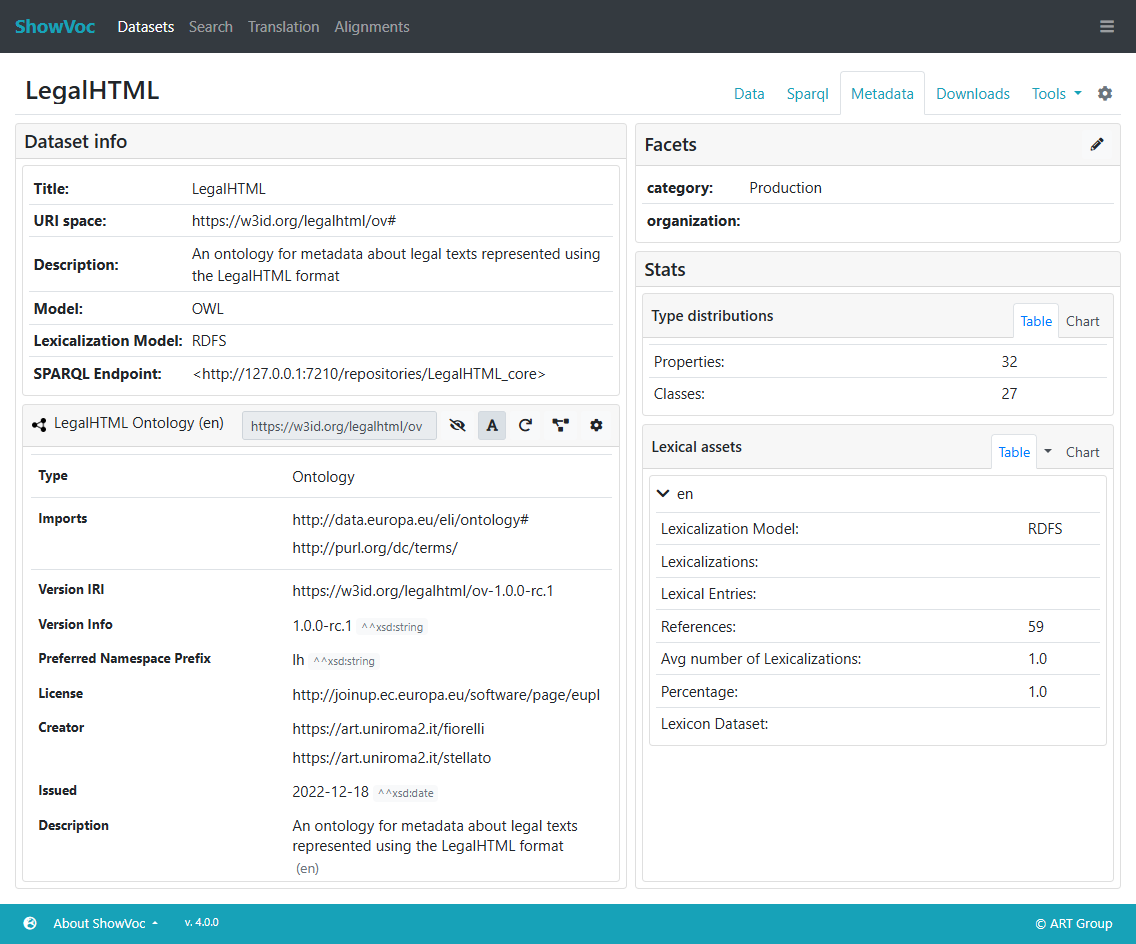
This page shows several tables describing different metadata of the datasets.
The top left table lists general metadata of the dataset which are automatically inferred by the system (they can be generated via "Create/refresh dataset metadata" from the Datasets manager in the Administration dashboard).
Under this table, a ResourceView for the resource identified by the dataset base URI, usually an owl:Ontology, whose description provides metadata about the dataset itself (distributed together with the data).
In the top right corner of the page, a Facets panel shows and allows the editing (only to authorized users) of the dataset facets, namely Category and Organization. Custom facets can be shown as well if properly configured from the Dataset manager.
Dataset stats
If the dataset medatata have been generated (by doing "Create/refresh dataset metadata" in the Dataset manager), then the Stats panel on the rigth side of the page, below the Facets panel, contains further information.
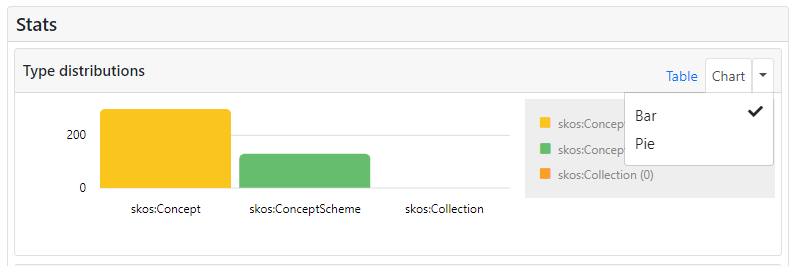
The top panel shows the Type distribution, namely tells the amount of resources for each well-known type (e.g. skos:Concept, skos:ConceptScheme, ...)
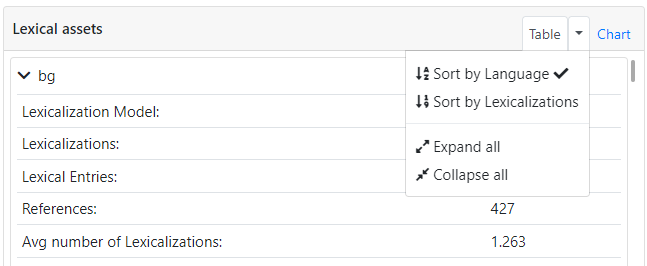
Statistics about the different languages present in the current dataset are also described under the Lexical assets panel. This statistics can be ordered by language ISO code (default) or by amount of lexicalizations.
It is possible to visualize these statistical data also as charts.
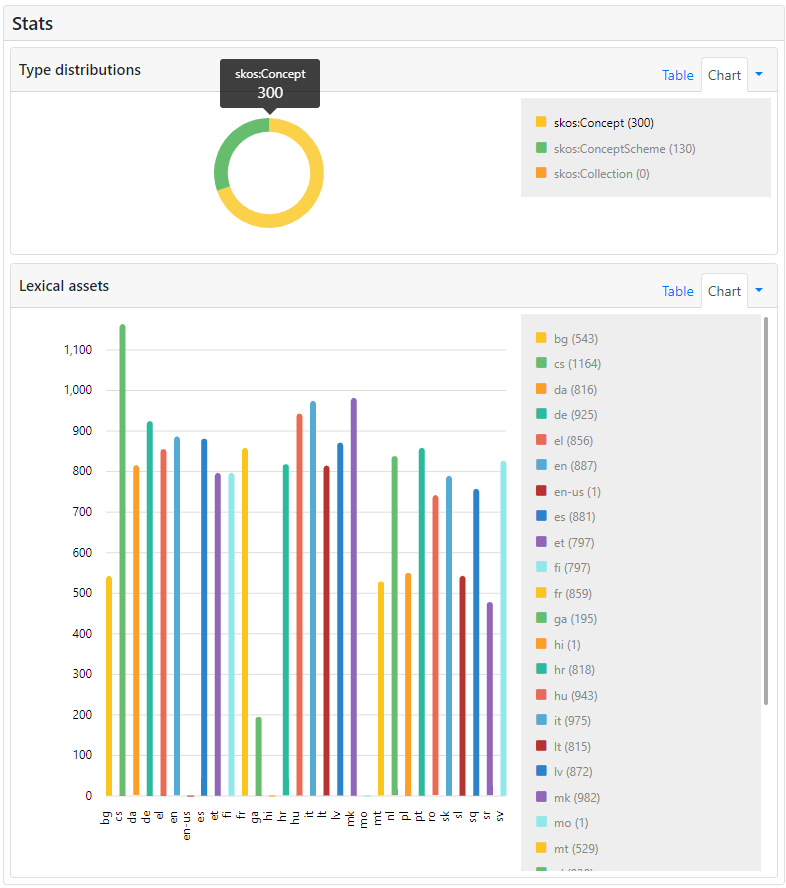
Two types of charts are available: pie and bar charts. The arrow on the right of the Chart selection allows you to switch between these two.
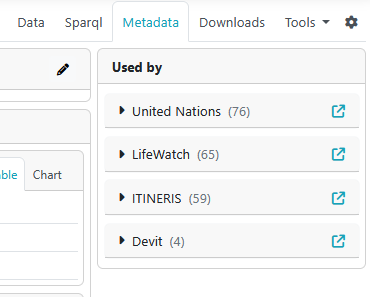
Used by
If the "Enable Digital Objects Annotation" is checked (in configuration) then, in the right part of the window you will see a "Used by" panel. This panel contains the list of Annotations of Digital Objects assocciated to any resource in the current project.
If you open any of the entries in the "Used by" panel, you can see the list of all of the Annotations of Digital Objects coming from that organization.
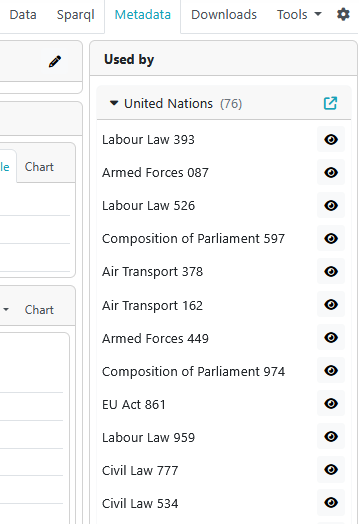
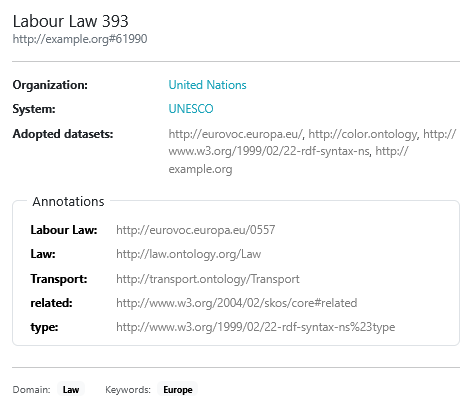
You can click on the eye button, near the single Annotation of Digital Object, to see all its information.
It also possible to see the Annotations of Digital Objects associated to a specific resource, in the current project, by opening the dataview page of that resource.