


Datasets Management
The datasets table
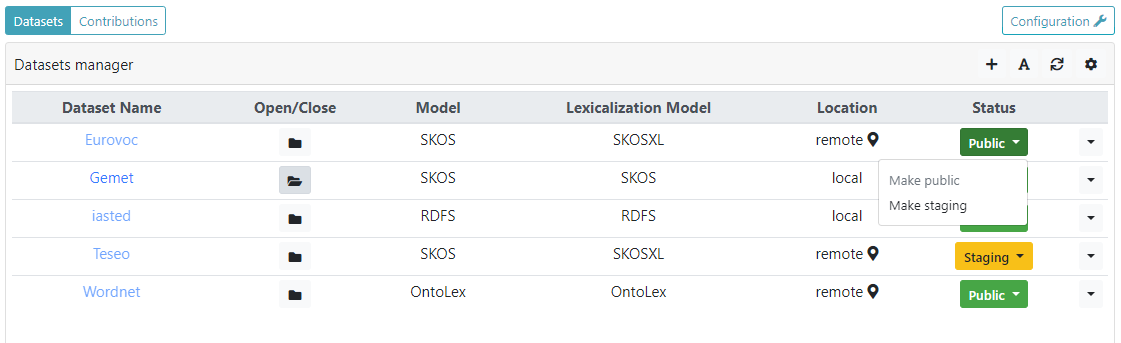
When the administrator access the Administration dashboard he is redirect directly to the Datasets manager panel. This panel simply contains a table with the list of datasets hosted in ShowVoc. Here follows a description of the table headers:
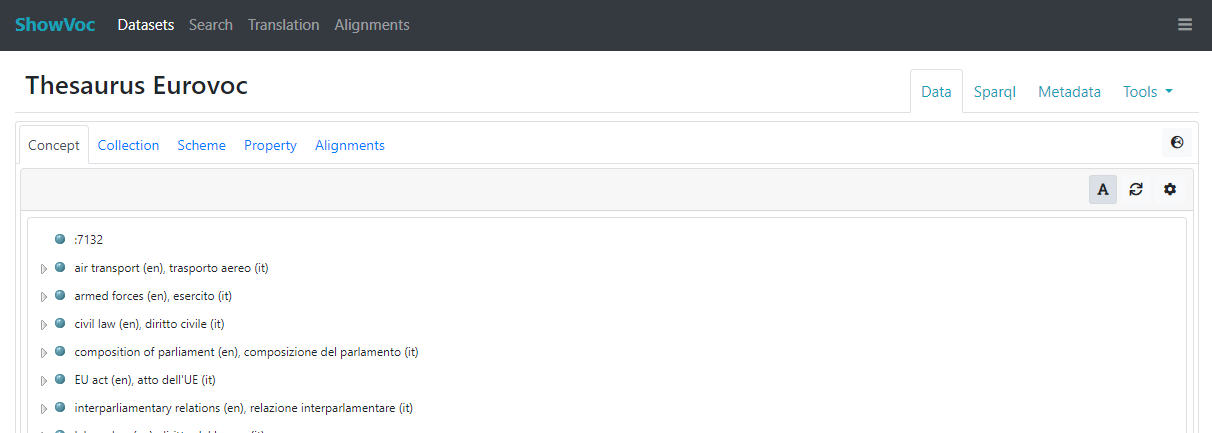
- Dataset Name: the name of the dataset, if clicked, user is redirected to the Data page of the dataset (only if the status is Public or Staging);
- Open/Close: tells whether a dataset has been opened inside the system. A dataset can be closed in order to release its resources. However, when a dataset is closed, it is not possible to access it (it should be still possible to include its resources in the search results, accordingly to the filters);
- Model: the type of the dataset, it can be an RDFS or OWL ontology, a SKOS thesaurus or an OntoLex lexicon;
- Lexicalization Model: the type of lexicalization adopted, it can be RDFS, SKOS, SKOS-XL or OntoLex;
- Location: the location of the repository. It can be remote, if hosted on an external triple store, or local if hosted directly on the RDF4J repository of the underlying SemanticTurkey server. In case the location is remote, further information are shown as tooltip on a i icon;
- Status: the status of the dataset, it can be Public, Staging, or Pristine.
Datasets management
From the Datasets manager panel, administrator user is able to create datasets and to manage them.
Create a dataset
To create a new dataset click on + button on the top right corner of the panel. You will be prompted with a window like the one in figure below:
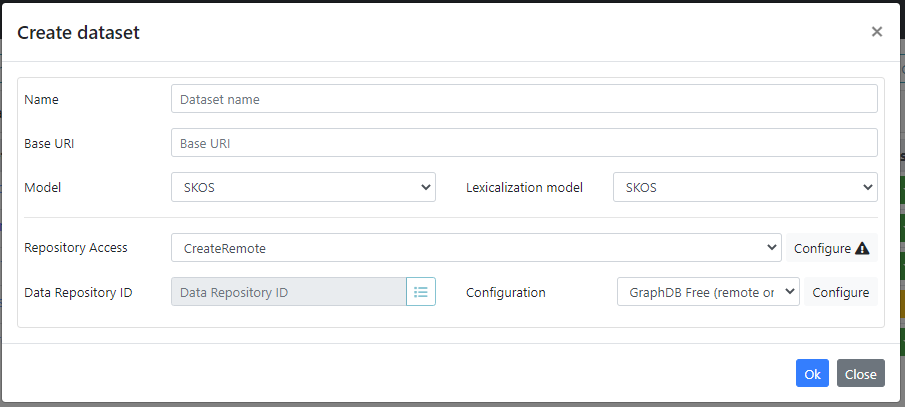
Here you have to fill (in order of appearace) the following fields:
- Name: the name of the dataset. Any name which can be stored as a folder in the file system is a valid dataset name.
- Optional data preloading: allows the user to preload data during the dataset creation. The available choices are:
- Do not preload any data: default selection, skips the data preloading.
- Preload from local file: loads the content of an RDF file picked from the local filesystem.
- Preload from URI: fetches and loads the data referenced by an URL (e.g. http://xmlns.com/foaf/0.1/).
- Base URI: any valid ontology URI is accepted. If the uri ends with no trailing # nor /, the default namespace will end with a #. If the URI ends with /, the default namespace will be the same as the baseuri.
- Namespace: defines the namespace for dataset resources; its value is automatically derived from the base URI according to the rules explained above and it's is locked by default.
- Model: it can be RDFS, OWL, SKOS or OntoLex depending on the model (RDFS and OWL for ontologies, SKOS for thesauri, OntoLex for lexicons) you want to adopt for your data.
- Lexicalization model: it can be RDFS, SKOS, SKOS-XL or OntoLex depending on the lexicalization model you want to adopt for your data. If the adopted Model is OntoLex, then the Lexicalization model is forced to be OntoLex as well.
- Data Store:>
- Repository Access: one of:
- CreateLocal: creates a local data repository.
- CreateRemote: creates a repository on a remote triple store. Currently there are configurable settings for RDF4J and GraphDB stores.
- AccessExistingRemote: access an existing repository and creates a dataset by using the data already there.
- Technology: specifies the technology of the triple store instance to be used. Currently only GraphDB and RDF4J are supported. When CreateLocal is selected, the choice is limited to RDF4J, which represents the embedded distribution included with Semantic Turkey
- Triple Store instance: enabled only for remote repositories, this selector allows specifying the remote triple store instance to use. It lists all available instances defined in the Data Storage page that are compatible with the chosen technology. New instances can also be created on the fly by clicking the + button on the right of the selector.
-
Data Repository:
- ID: the identifier of the repository. For both "Create" options for repository access, this field is locked and follows predefined conventions. When AccessExistingRemote is selected, the field is editable to enter the remote repository ID. A browsing option is available to select from repositories hosted on the specified triple store instance.
- Configuration: the configuration to use to manage the repository within the instance. It lists all available configurations defined in the Data Storage page that are compatible with the chosen technology. New configurations can also be created on the fly by clicking the + button on the right of the selector, while existing ones can be edited through the pencil button.
- Repository Access: one of:
- Abstract Dataset: each dataset in ShowVoc must be associated with an Abstract Dataset. The selector lists all Abstract Datasets available in the Metadata Registry. The compass icon allows automatic detection of an Abstract Dataset based on the entered base URI, while a new one can be created on the fly using the
+button. - Version: specifies the version number of the dataset. A default value of
1.0.0is prefilled but can be edited as needed. The Current checkbox marks the created version as the current one for the selected Abstract Dataset.
Section Optional Settings:
This section is initially hidden, because the default configuration will be fine in most circumstances. The figure below shows the content of the section, after the user clicked on the collapse/expand (rotating) triangle near the section name.
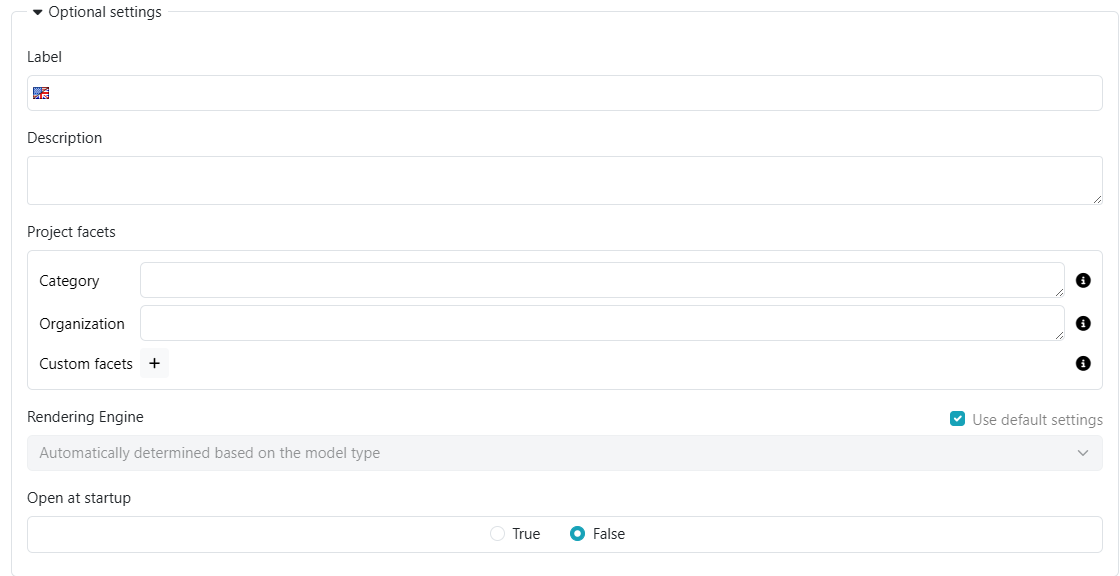
These are the additional settings available here:
- Label: a human readable label displayed in place of the dataset name when the dataset rendering is enabled.
- Description: a brief optional description that will be displayed in the Datasets page.
- Project facets:it allows the assignment of dataset facets contextually to the dataset creation.
- Rendering Engine: this section allows to configure which Rendering Engine will be used to produce a human-intelligible representation of the resources displayed in different parts of the UI.
- Open at startup: If true, the dataset is automatically opened when SemanticTurkey server starts up.
Project Templates
To facilitate and accelerate the creation of new datasets, dataset templates can be defined. These templates prefill the main information required during dataset creation, reducing repetitive configuration tasks and ensuring consistency across datasets.
A template includes most of the information found in the dataset creation form and already explained in the previous section, such as a base URI, which in this case may represent a common base URI (or prefix) shared by multiple datasets, the data model, the lexicalization model, the data store configurations, and a subset of the optional settings.
None of these fields is mandatory; it is possible to fill in only the items that are useful and leave the others empty. This allows templates to provide a complete starting point for new datasets while still leaving room for dataset-specific customization.
To enable the dataset template editor, the "Create Template" switch located in the top-right corner of the dataset creation form must be activated. Once enabled, the form layout changes slightly, displaying only the sections relevant for defining a template.
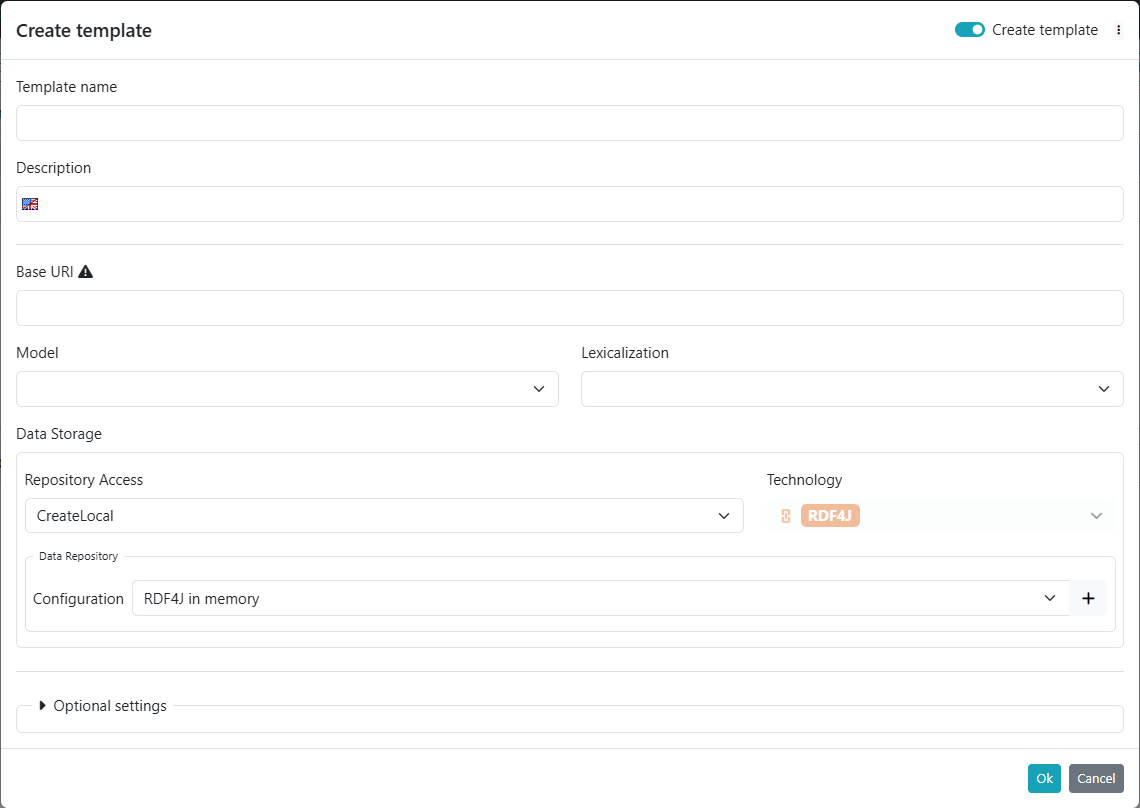
In addition to dataset specific aspects, a template also requires a name and a description to be provided.
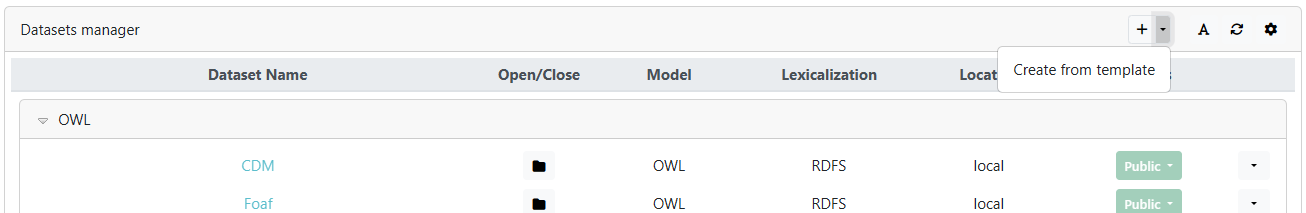
Templates can be saved for reuse in future dataset creation. They can be reused either by loading a template directly from the dataset creation form using the "Load Template" option in the top-right corner, or by selecting the "Create from Template" option positioned next to the + button on the Dataset manager dashboard. Once a template is chosen, the dataset creation form is automatically filled with the fields defined in the template.
Actions on dataset
Under the last column of the table, a dropdown menu allows the management of a dataset
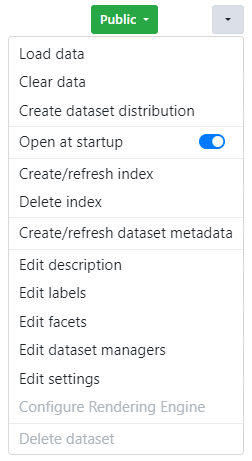
The available actions are:
- Load data: Allows administrators to load data into the given dataset. This action is enabled only for open datasets.
- Clear data: Allows administrators to clear the data from the dataset. is enabled only for open datasets.
- Create distribution download: Allows the creation of a downloadable distribution of the given dataset that will be available in the Metadata page.
- Open at startup: when activated, the dataset is automatically open at system startup.
- Create/refresh index: Creates (or refreshes in case already created) the index of the dataset content in order to support the search feature.
- Delete index: Deletes the dataset index.
- Create/refresh dataset metadata: Creates (or refreshes in case already created) the metadata of the dataset content. This is useful in the alignment feature.
- Edit description: Prompts a text field for providing a dataset description. This description will be visible in the Datasets page.
- Edit labels: Opens the editor of the dataset multilingual label. More details in the dedicated section below.
- Edit facets: Allows to edit the dataset facets like category, organization or custom defined.
- Edit dataset managers: Provides the capability to manage the dataset manager users associated with the specific dataset. More details in the dedicated section below.
- Edit settings: Allows the customizations of some dataset settings (details later)
- Configure Rendering Engine: allows to configure which RenderingEngine will be used to produce a human-intelligible representation of the resources displayed in different parts of the UI.
- Delete dataset: Deletes the dataset and the related index. In case the dataset is hosted on a remote triple store, it will be possible to delete the remote repositories as well. This action is enabled only for closed datasets.
Loading data
In order to load data into a dataset, user needs to fill the following form prompted once Load data entry has been clicked.
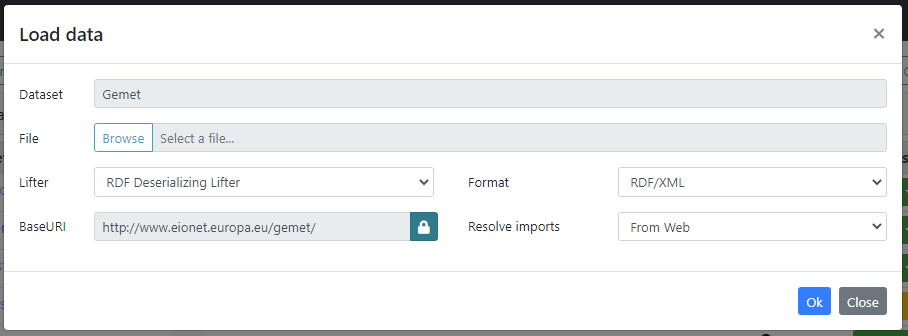
- Dataset: the dataset name. This field is locked and is prefilled with the name of the dataset where the data is going to be loaded.
- File: allows the selection of a file containing the data.
- Lifter: a lifter transforms a byte sequence to RDF. In this form two lifters are available:
- RDF Deserializing Lifter, for loading RDF data (e.g. .rdf, .ttl, .nt files)
- Zthes Deserializing Lifter, for converting and loading ZThes data files.
- Format: the format of the input file. Most of the time, once the file is selected the format is automatically detected by the system and there's no need to edit this field.
- BaseURI: the BaseURI of the data. By default this field is disabled and its value is set to the dataset BaseURI, but it can be forced by clicking on the lock button.
- Resolve imports: instructs the system on how to import vocabularies specified on transitive dependencies, that is, vocabularies that are owl:imported by the loaded data, or by other vocabularies in turn imported by it.
These options are available:
- Do not resolve: simply ignore transitive import declarations
- From Web: transitive imports are resolved by trying to import the related vocabularies through their URIs specified in the owl:imports declarations
- From Web with fallback to Ontology Mirror: if a vocabulary required by a transitive import is not found on the Web, then the Ontology Mirror will be used as a fallback solution
- From Ontology Mirror: transitive vocabulary dependencies will be resolved locally on the Ontology Mirror
- From Ontology Mirror with fallback to Web: if a vocabulary required by a transitive import is not found on the Ontology Mirror, then the Web will be used as a fallback solution
Dataset labels
A dataset is identified by its name which, once created, cannot be modified. This limitation is due to the fact that the dataset name is actually an identifier which is widely referenced in the data structure of SemanticTurkey.
Anyway, it could be convenient for the user to visualize the dataset with a more user-friendly label. So, in order to overcome this limitation, ShowVoc allows authorized users to assign multilingual labels to the datasets.
By clicking on the Edit labels entry, under the dataset menu, the following editor is available.
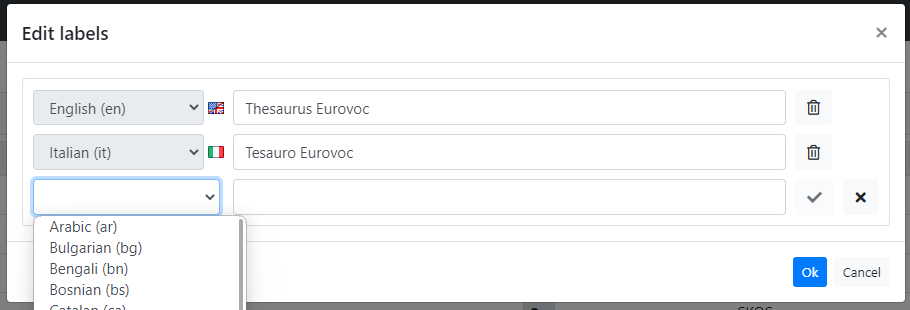
Here it is possible to add, edit and delete labels in several languages (only one label per language). Then, according the active UI language and the rendering status (![]() ), which can be set in the Dataset Manager dashboard or in the Datasets page, the datasets will be widely shown through the associated label as in the following examples.
), which can be set in the Dataset Manager dashboard or in the Datasets page, the datasets will be widely shown through the associated label as in the following examples.
Dataset settings
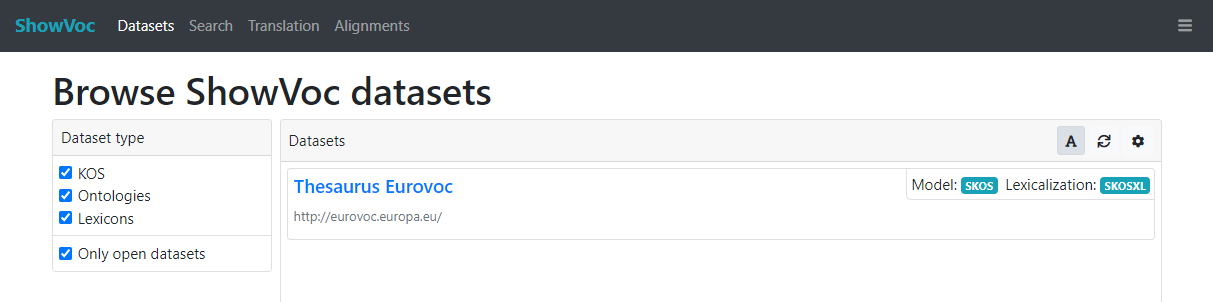
Hosted Public datasets can be accessed by visitor users through the Datasets page. From the Datasets Settings dialog, administrator can modify default settings for the visitors.
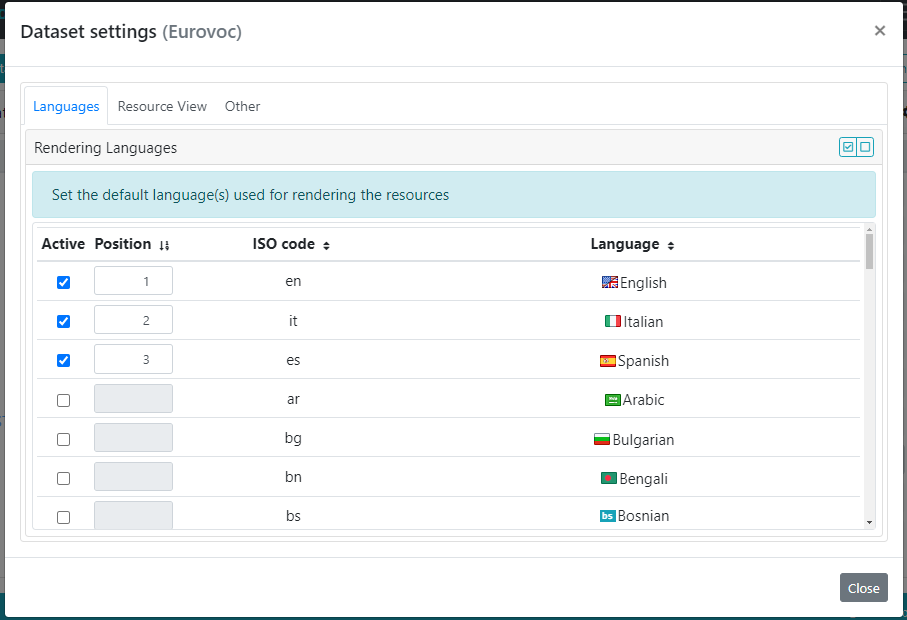
Rendering languages
This Languages panel sets the default language(s) that can be considered for rendering the resources in the Data View. The defined languages can be sorted by name, code or the rendering order ("position" column). The "active" column determines which languages have been selected for being shown. No selection is equivalent to "show all languages". As just stated, this represents a default dataset setting, indeed visitor users can customize them as described in the Data Structure View section here.
Resource View template
Moving to the ResourceView tab, it is possible to customize several aspects of the ResourceView.
The structure of the ResourceView is guided by a template. Every type of resource defined in ShowVoc is mapped with a pre-defined template, for example, the default template for concepts has the following sections (or partitions): Types, Top Concept of, Schemes, Broaders, Lexicalizations, Notes and Other properties. From the Template panel it is possible to edit these mappings between resource types and sections. After the selection of a resource type, the two Sections lists show respectively: the sections assigned to the related template (in the left list) and the rest available (in the right one). A partition can be added to, or removed from, the visible ones through the two arrow buttons between the list (after selecting a partition). An active section can be also moved in a different position in the list by using the buttons on the panel header.
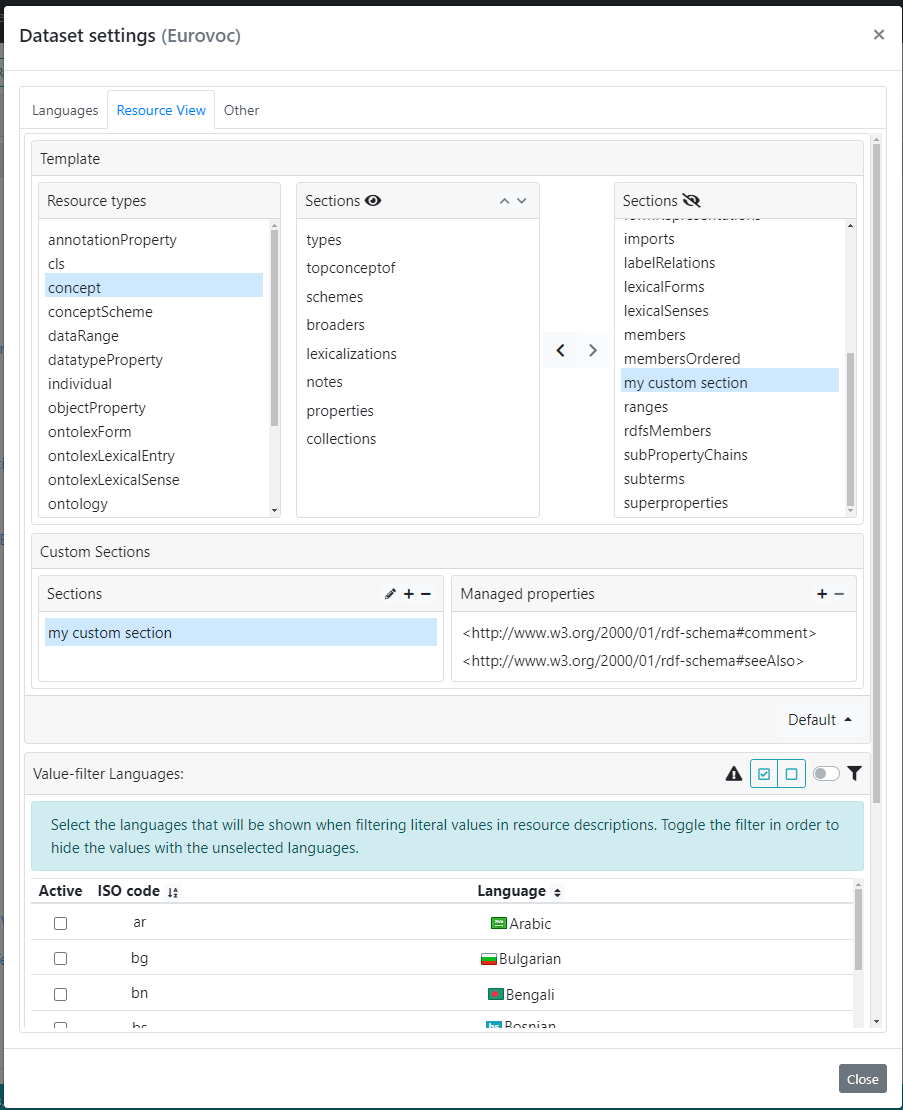
The composition of a single template section is based on a statements consumer which, as the name suggests, "consumes" those statements of a resource that involves specific managed properties. For example, the Types section is bound to a consumer which manages rdf:type and its sub-properties. So, defining a new section means, under the hood, defining a new consumer. In order to achieve that, we can use the Custom Sections panel which is splitted in two sub-panels: Sections and Managed properties.
The first one basically allows the creation of new custom sections, the renaming or the deletion of the created ones. In the second one user can define the list of managed properties, namely those properties that will be processed by the consumer and for which the related values will be collected under the section.
Note that a consumer processes also the sub-properties of its managed properties, moreover, the properties are processed only once by the first consumer that manages them, this means that if we define a custom section that consumes rdf:type property, it will have no effect if it is placed after Types section (that already consumes the same property), on the contrary, if placed before Types, our custom consumer will process rdf:type, the related section will show its values and Types will result in an empty section.
Resource View section customizations
In the Resource View, each section’s visibility can be customized individually, allowing fine control over what is shown to users without altering the overall template layout. Through the Default Section Visibility panel, you can enable or disable the display of specific sections for each type of resource.
Unlike template management, adjusting a section’s visibility here does not affect the ability of the section to "consume" the properties within it. This means that even if a section's visibility is turned off, its properties will still be available for consumption, though they won't appear in the Resource View interface.
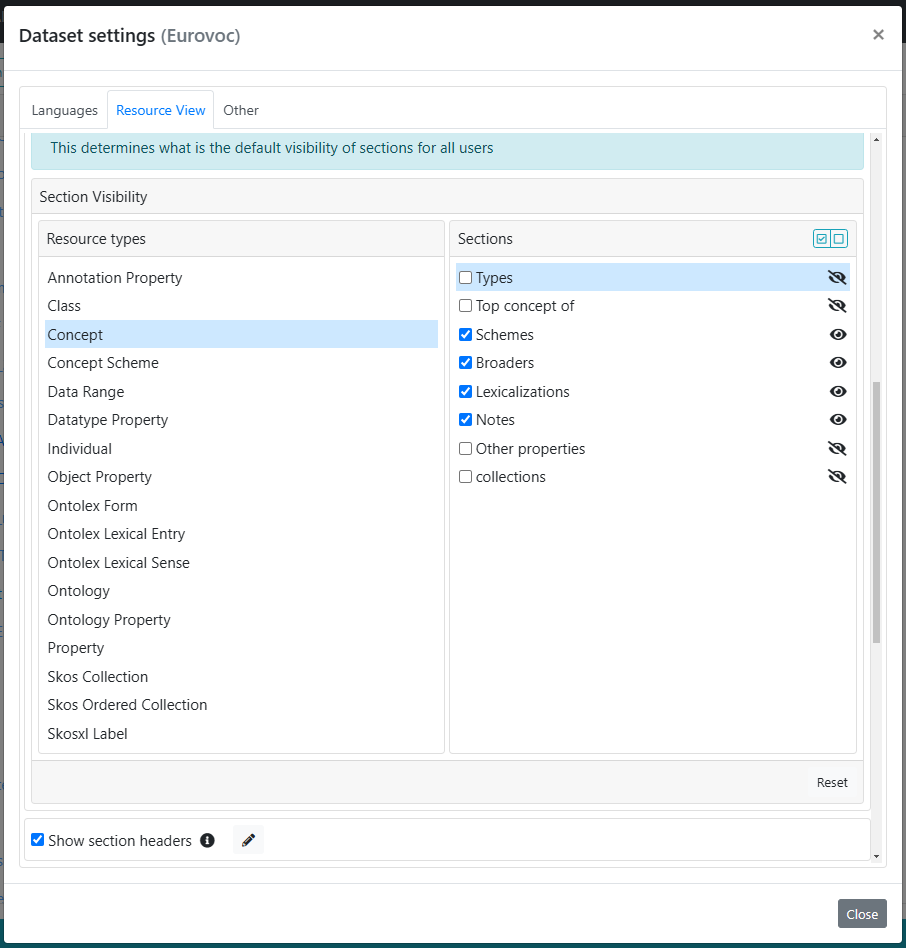
Accompanying the Default Section Visibility panel is the Show Section Headers option, which allows you to control how each section is visually presented in the Resource View. Enabling this option adds a clear divider and displays the title of each section, creating a more structured and easily navigable layout.
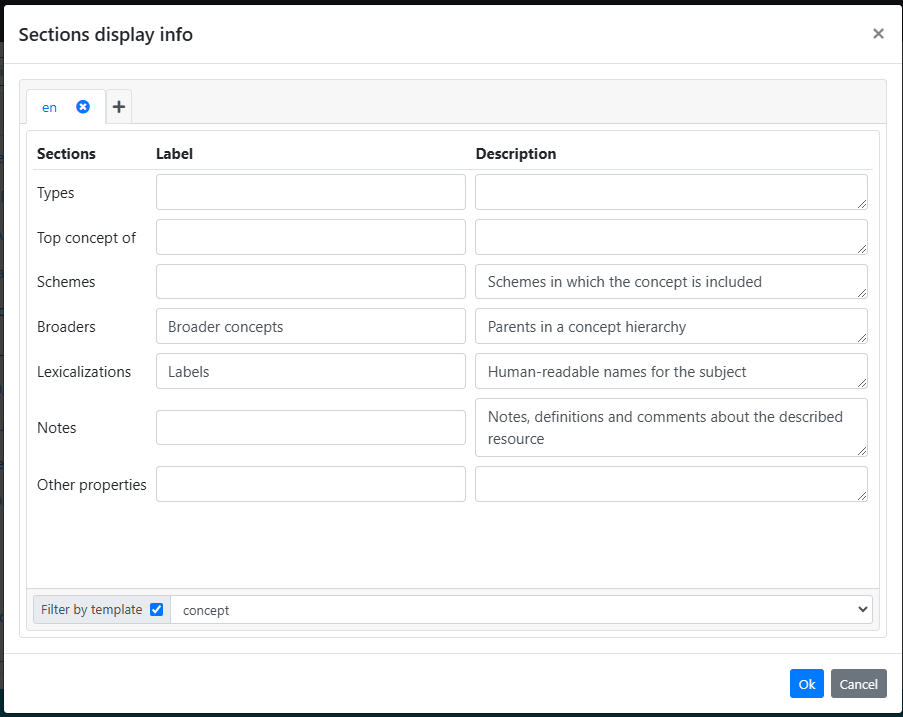
For further customization, you can use the button to the right of this option to modify the title and add a description to each section. Both titles and descriptions can be provided in multiple languages, automatically adapting to the user’s selected interface language.
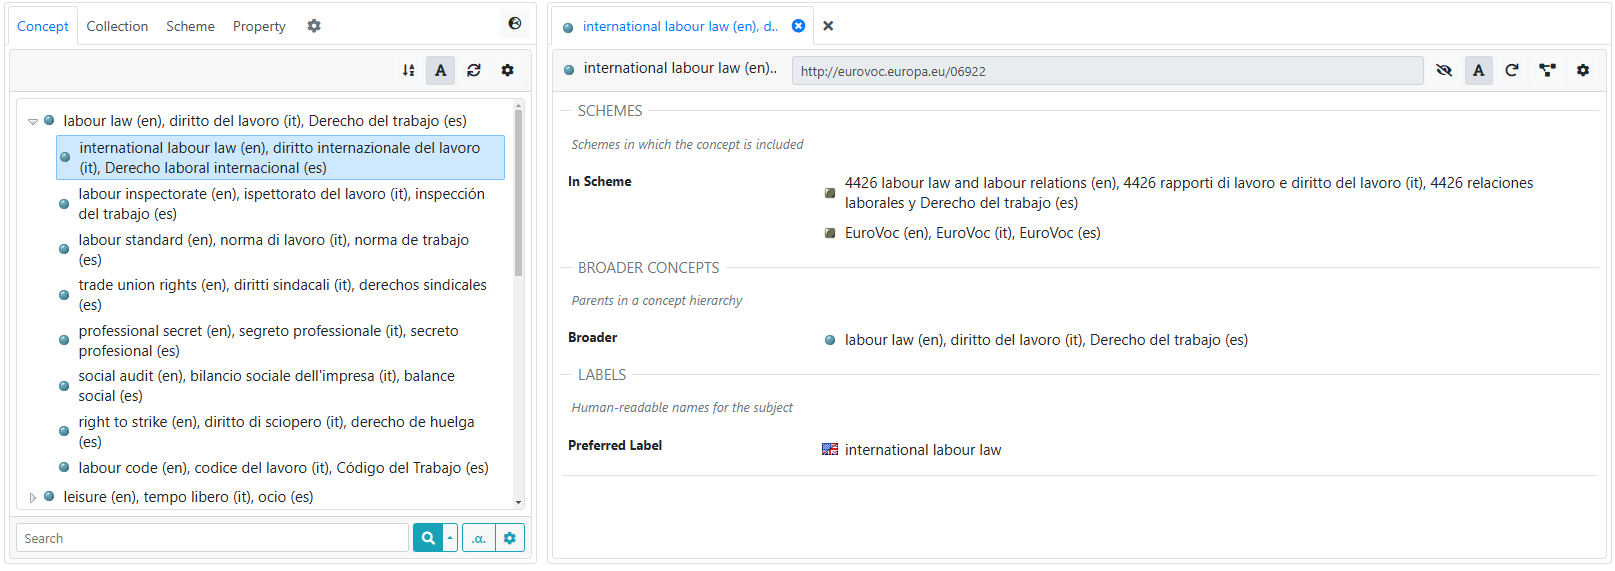
The following image shows the result of the above customization. In particular, it is possible to see the clear division among the sections including the custom titles and descriptions
Customized rendering of predicates
The Resource View includes a feature that allows you to customize how property labels are rendered, offering an alternative to the default labels. In the settings editor, you’ll find a Render Predicate Labels option. When enabled, this setting displays custom labels for properties instead of the default labels in the Resource View. To the right of this option, a button opens the editor for defining these custom labels.
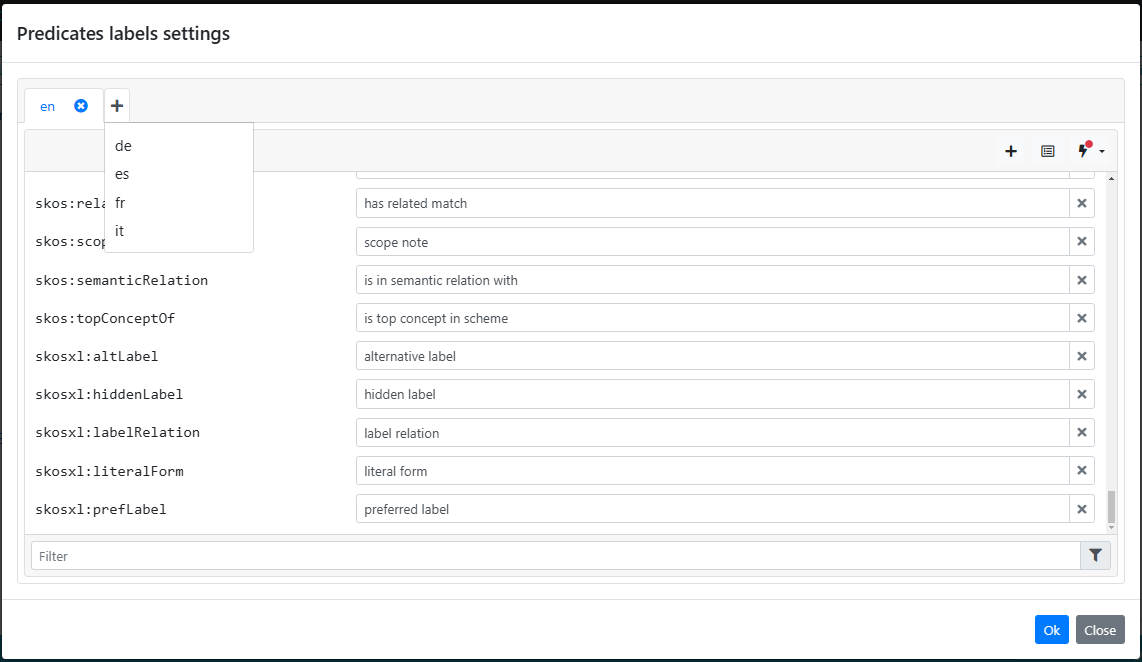
The custom label editor is organized with a tabbed interface, allowing for labels in multiple languages. A new tab can be created by clicking the + tab, which prompts you to select a language from those available in the platform. Once a language is chosen, the editor will be initialized as an empty workspace.
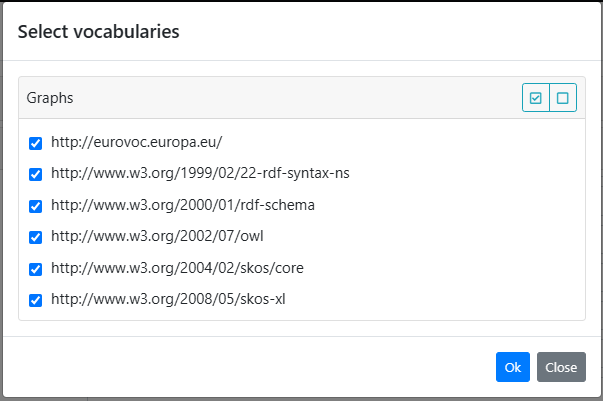
To populate this workspace, you can click the button  , which allows you to select specific vocabularies from which to import predicates. This action brings in the predicates defined in those vocabularies, enabling you to begin customizing their labels.
Additionally, there is a lightning icon button that can be used to bootstrap the custom labels. This feature initializes the default labels (either rdfs:label or skos:prefLabel) for the available predicates directly from the vocabulary, providing a quick starting point for customization.
With these tools, the custom label editor allows flexible control over how properties are labeled in the Resource View, enabling a more tailored and multilingual user experience.
Value-filter languages
An additional panel under ResourceView tab is the Value-filter languages. The behavior of this component is already explained under the section ResourceView available at Data View page.
Other settings
Finally, the third tab (Other) collects further settings for the dataset. The content of this tab mostly depends on the dataset model. As it is shown in the following image, a Concept tree settings panel is available since it is editing the settings of a SKOS dataset. Depending on the dataset model we could have different panels, for example in case of Ontolex datasets it will be shown also an editor for Lexical Entry list settings, or again, in case of OWL datasets it will prompted an editor for Instance list settings.
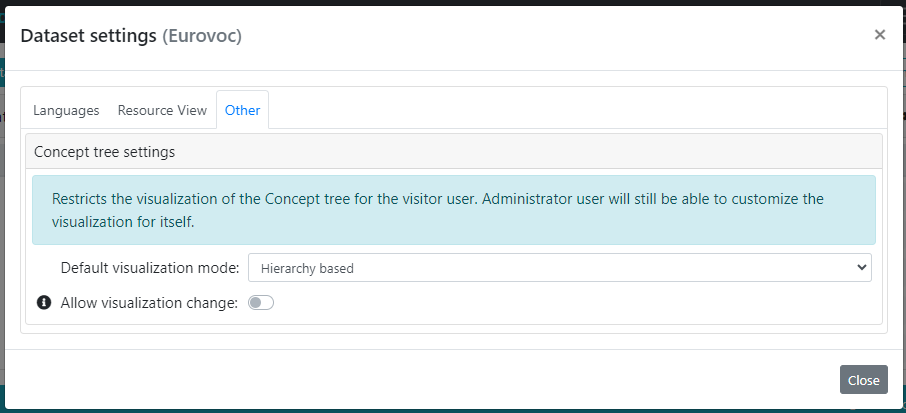
Basically, these settings tell the default mode for visualizing the data in the structures (trees or lists). The mode can be forced or limited so that visitor users experience is affected. For instance, administrator may choose to revoke to visitors the possibility to switch from one visualization mode to another (through the Allow visualization change option) and forcing them to the choice made here.
More details about these settings in this page.
Dataset managers
The "Edit Dataset Managers" entry in the actions menu of a dataset opens the following dialog.
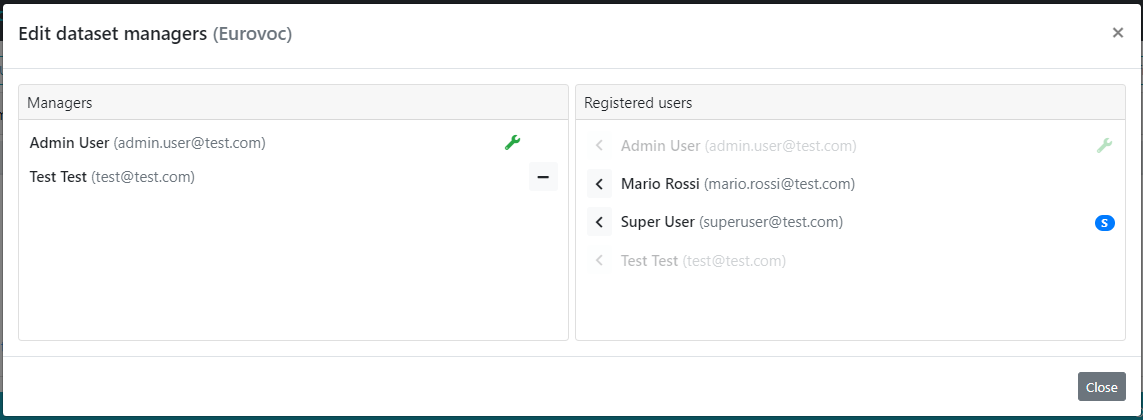
Within this editor it is possible to manage the project manager users associated with the specific dataset. This functionality enables administrators to add or remove project managers simply by moving users between Managers and Registered users columns. Administrator users cannot be removed from the list of managers.
Dataset status
As seen previously, the last column of the table shows the current status of the datasets. What exactly means the status? In order to answer to this questioni it is necessary to briefly explain how a dataset is created in ShowVoc.
A dataset in ShowVoc can be created in two ways: explicitly by the administrator, as seen before, or after a submission of contribution request for a stable resource.
Once the contribution request is evaluated and accepted by the administrator, a new dataset is created. This new created and empty dataset is then in the Pristine status.
The contributor can then proceed to load the data into the dataset. Once the data is successfully loaded, the dataset is no more empty and moves from the Pristine status to the Staging one.
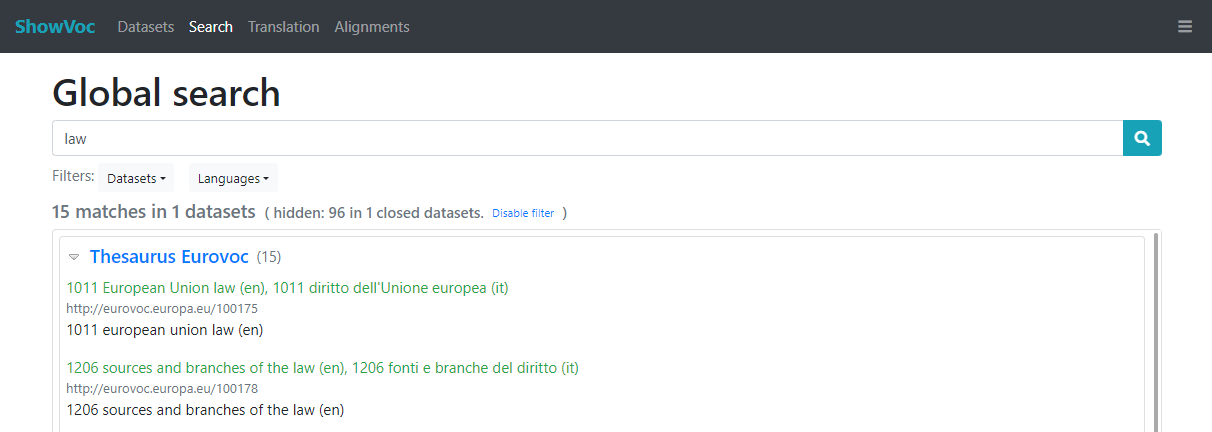
A dataset in the Staging status is not visible to a "simple" user, a visitor, this means that in the Datasets page it will not appear in the datasets list and also the contained resources will not be returned by the Search feature. In short words, the Staging status can be described as private dataset, only visible to the administrator. In order to make visible the dataset with its content, the administrator needs to switch the status to Public.
A dataset created by the administrator through the Create dataset form is instead in Staging status even if it is empty. So, summing up, a dataset goes through the Pristine status only when created by means a contribution and waits for data to be loaded.
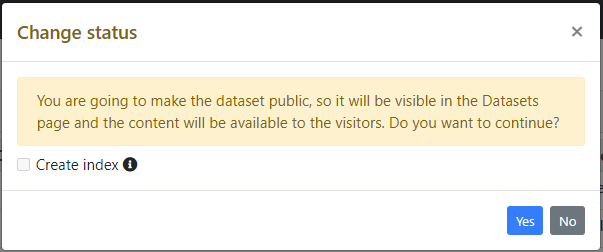
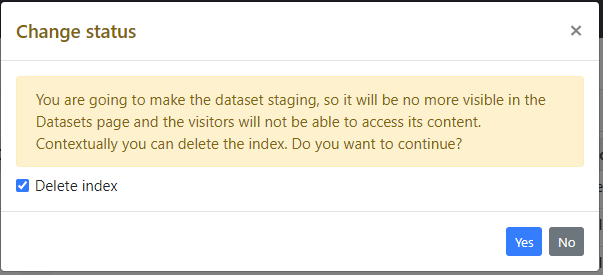
A Public dataset can be later moved back again to the Staging status in order to restrict its visibility, and in the same way a Staging dataset can be made Public again. The only status that cannot be set or changed manually is the Pristine one, which is automatically assigned by the system once the dataset is created and then it's removed (in favour of the Staging) once the data is loaded by the contributor.
The intermediate stage Staging, between Pristine and Public, has been introduced not just for handle the dataset visibility, but also for allowing the administrator to inspect the data that a contributor has loaded before to make it public and to eventually prevent incorrect data from being published on ShowVoc.
When a dataset switches between the Staging and Public status, administrator can decide also whether to create/delete the index used for the search feature.
Dataset facets
In case of large amount of datasets loaded in ShowVoc, the default view, which consists in a flat list of datasets, may result poorly organized and difficult to read. This is where the facts-based view comes useful. This view allows you to group datasets according a chosen facet in order to make the view cleaner and organized efficiently.
The facets are aspects and attributes that characterize a dataset. ShowVoc provides six pre-defined facets: Model, Lexicalization, which are unmodifiable attributes chosen during the creation of the dataset, Category and Organization.
In addition to such pre-defined facets, ShowVoc allows the administrator to define custom facets.
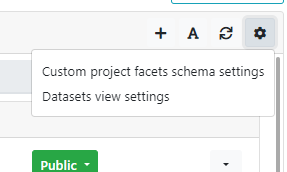
Clicking the "cog" button in the top right corner of the panel and selecting the entry Custom project facets schema settings, the following dialog is prompted.
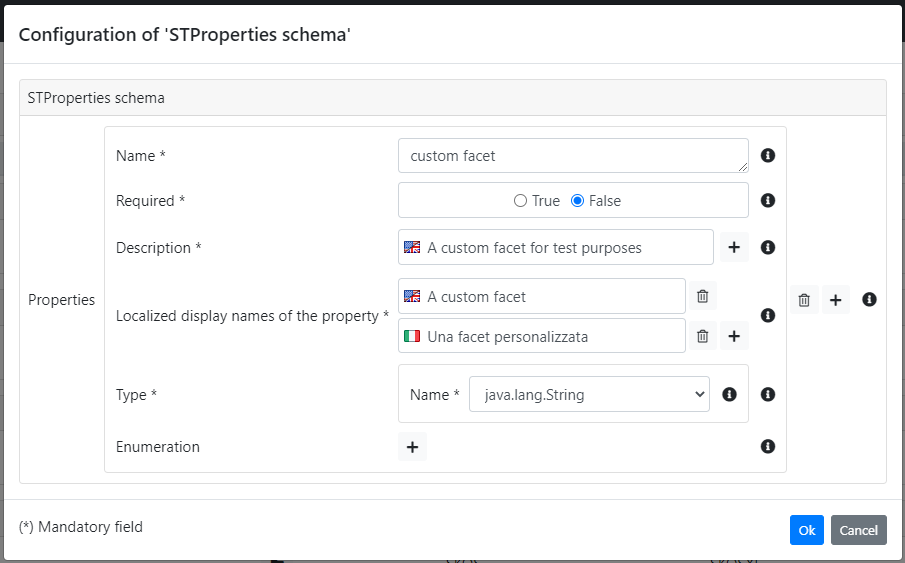
A new facet can be added through the "plus" button. Then the editor shows several fields that can be filled in order to define a new facet:
- Name: a unique name that identifies the facet;
- Required: tells if the facet must be provided to the dataset;
- Description: a natural language description that provide further information to the user (it will be displayed as a tooltip). It is possible to provide multiple descriptions in different languages, ShowVoc will display the proper description according the chosen localization;
- Localized display names: the facet name to display to the user. Also in this case, as well as the description, multiple names can be provided in order to support the multilingual UI;
- Type: the value type of the facet (e.g. string, integer, boolean, ...);
- Enumeration: optionally an enumeration can be defined in order to restrict the admitted values;
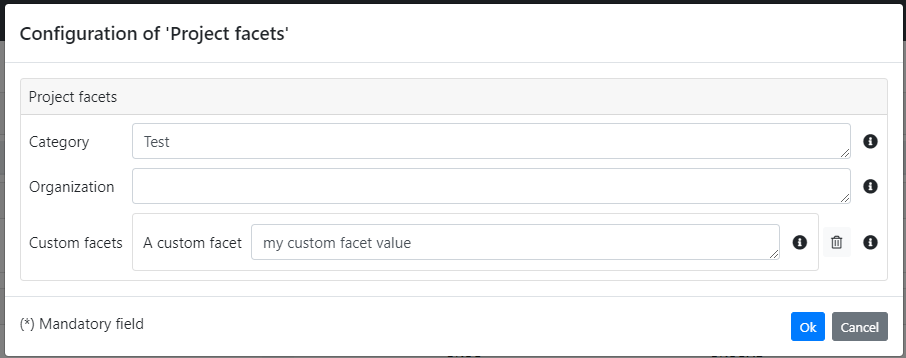
Clicking on the Edit facets entry in the dataset context menu (under Actions column), the following dialog shows up and it allows the editing of the dataset facets. As you can see, there are the built-in facets Category and Organization plus the custom one just defined.
Now that we know what facets are, how to define customs and how to set them in a dataset, let's see how can they be used to organize the dataset view.
As we have already seen, the "cog" button, placed on the topbar of the dataset list, opens a menu.
Selecting Dataset view settings, user can customize the visualization of the dataset view.
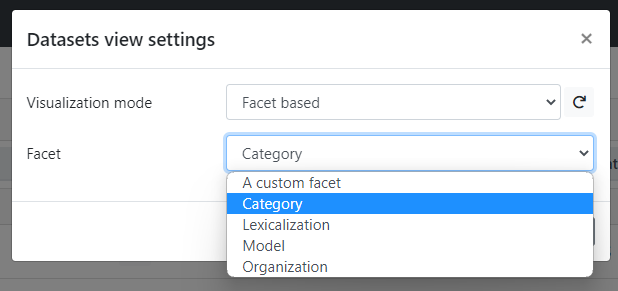
Here it is possible to choose between two visualization mode: List, namely the "classic" flat list of datasets, and Facet based. Selecting the latter, it appears a Facet selector which allows the selection of the facet on which the datasets have to be grouped.
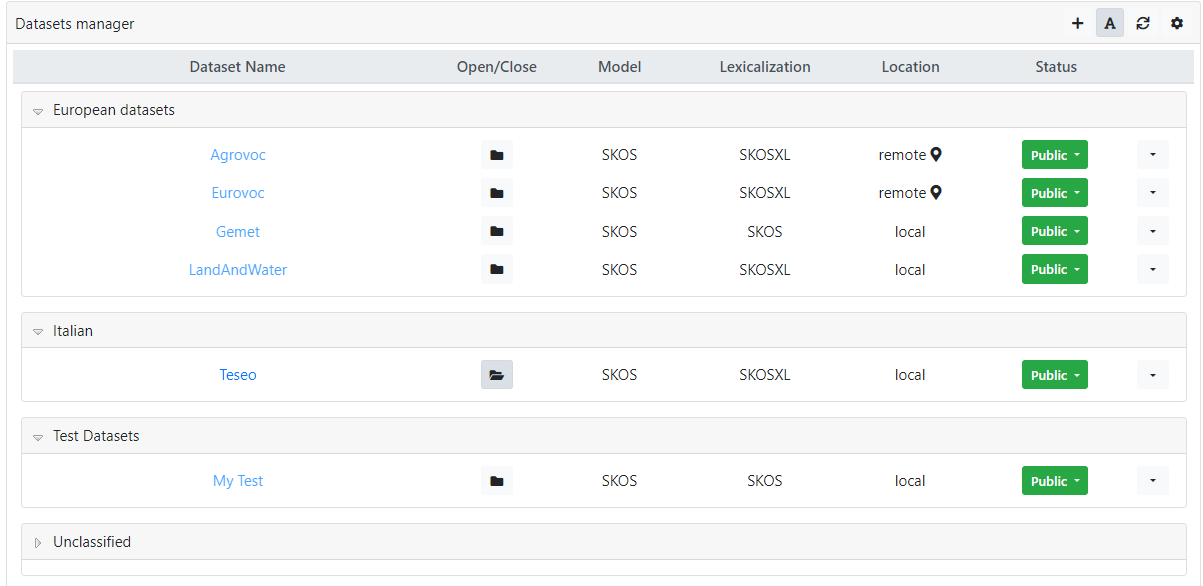
Here it is an example of facets-based visualization based on Category. The categories here shown have been assigned arbitrarily by the administrator. The last one "Unclassified" is a dedicated group that collects those datasets where the category (or in general the chosen facet) has not been specified.
The possibility to change the visualization preferences through the Datasets view settings dialog, is also available in the Datasets page.
Super User capabilities
The Datasets manager table is also accessible by Super User. From this page, Super User is authorized to create new datasets and to perform most of the actions described in this page with some exceptions. In particular:
- The table lists only datasets directly created by the Super User.
- Super User cannot open/close datasets.
- Super User cannot change dataset status (make dataset public/staging).